Achieving balance in the planning of natural and artificial environments necessitates tools that provide both the expert and the resident a comprehensive overview of landscape quality in different regions. What are the tools to assist in the analysis of life-based data?
Open Data-Based Landscape Analysis
Landscape architect Priit Ingver from TalTech compiled as his graduate thesis a method of landscape analysis based on open data across Estonia which was then tested in the context of four small towns (Elva, Kärdla, Sindi and Türi). The principles of a quantitative approach to landscape analysis have been in use since 19691 but due to availability of open data and increase of computation speed it is now possible to thoroughly and rather quickly evaluate large areas. Application of the method is preluded by dividing the research area into layers based on specific criteria. Each layer is then appraised according to rules which enable converting landscape elements into numerical values, perform calculations and compare different landscapes.
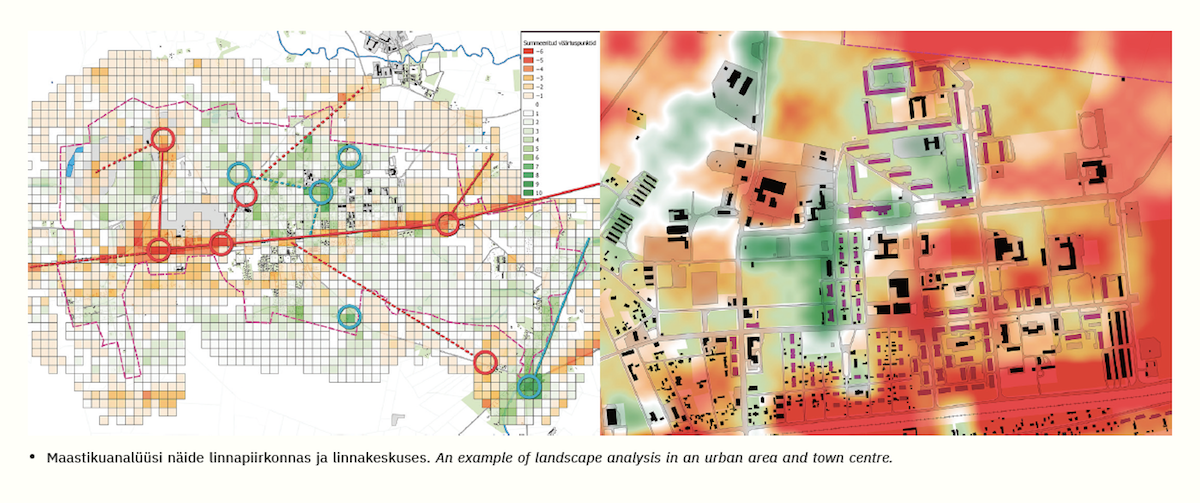
Elements used in landscape analysis comprise the built as well as the natural environment and have been divided into layers of both positive and negative values. The positive layers account for more biodiverse options (such as wetlands), air quality, infiltration capacity of the soil (such as tree crown overlap), aesthetics and heritage (such as cultural heritage objects), accessibility of valuable sites (such as light traffic roads network) and possible future development potential (such as public land). The negative layers include areas inducing noise and vibration (such as railroads), air and soil pollution (such as waste facilities), landscapes that need to be surrounded by a cleared-out corridor (such as high-voltage overhead lines) and areas where land utilisation has resulted in irreversible effects (such as industrial land-use). All created layers are pieced by an even 100×100 metre grid covering the entire area under scrutiny2. The gridding function is employed in landscape analysis so as to better comprehend the nature of the different spatial segments and their interconnectedness. In the last phase of the method the results are summed and a natural environment services evaluation map is drawn up3. The value-based overview map enables to recognize patterns, trends, highly valued and undervalued areas.
A pilot project led by the Ministry of Finance4 focused on mapping shrinking urban areas and implemented the given method in the landscape analyses of the pilot regions. In the context of shrinking, the importance of built infrastructure is being gradually overridden by green infrastructure as a tool that enables to bind together scattered shrinking habitats, while providing environmental conditions for other species to flourish, thus increasing biodiversity. Landscape analysis is thus a significant part of a strategy dealing with shrinking for the purposes of securing ecosystem services, adapting to climate change, replenishing landscapes impoverished as a result of intensive agricultural activity and connecting emptied-out districts with the rest of the town or community.5
Green Meter
Green Meter6 is an app built for measuring how the rural and urban landscape impacts on biodiversity. The previously described open-data-based landscape analysis differs from the Green Meter by how the latter only analyses natural biodiversity, excluding for example cultural landscape values.
Green Meter was created by scientists at the Landscape Biodiversity Workgroup and Macroecology Workgroup, Institute of Ecology and Earth Sciences, University of Tartu. The application uses an algorithm to estimate the various landscape parameters at any point location on the Estonian mainland. Green Meter is able to identify and visualise on a 100×100-metre analysis square grid the regions in the landscape that are more or less supportive of biodiversity, providing a total Green Meter index between 0–100 per observed point location in a 500-metre radius. Lower total index values indicate that the structure of the landscape and the changes that have occurred therein are not beneficial for biodiversity in the observed region. Higher values are indicative of high quality landscapes in terms of biodiversity.
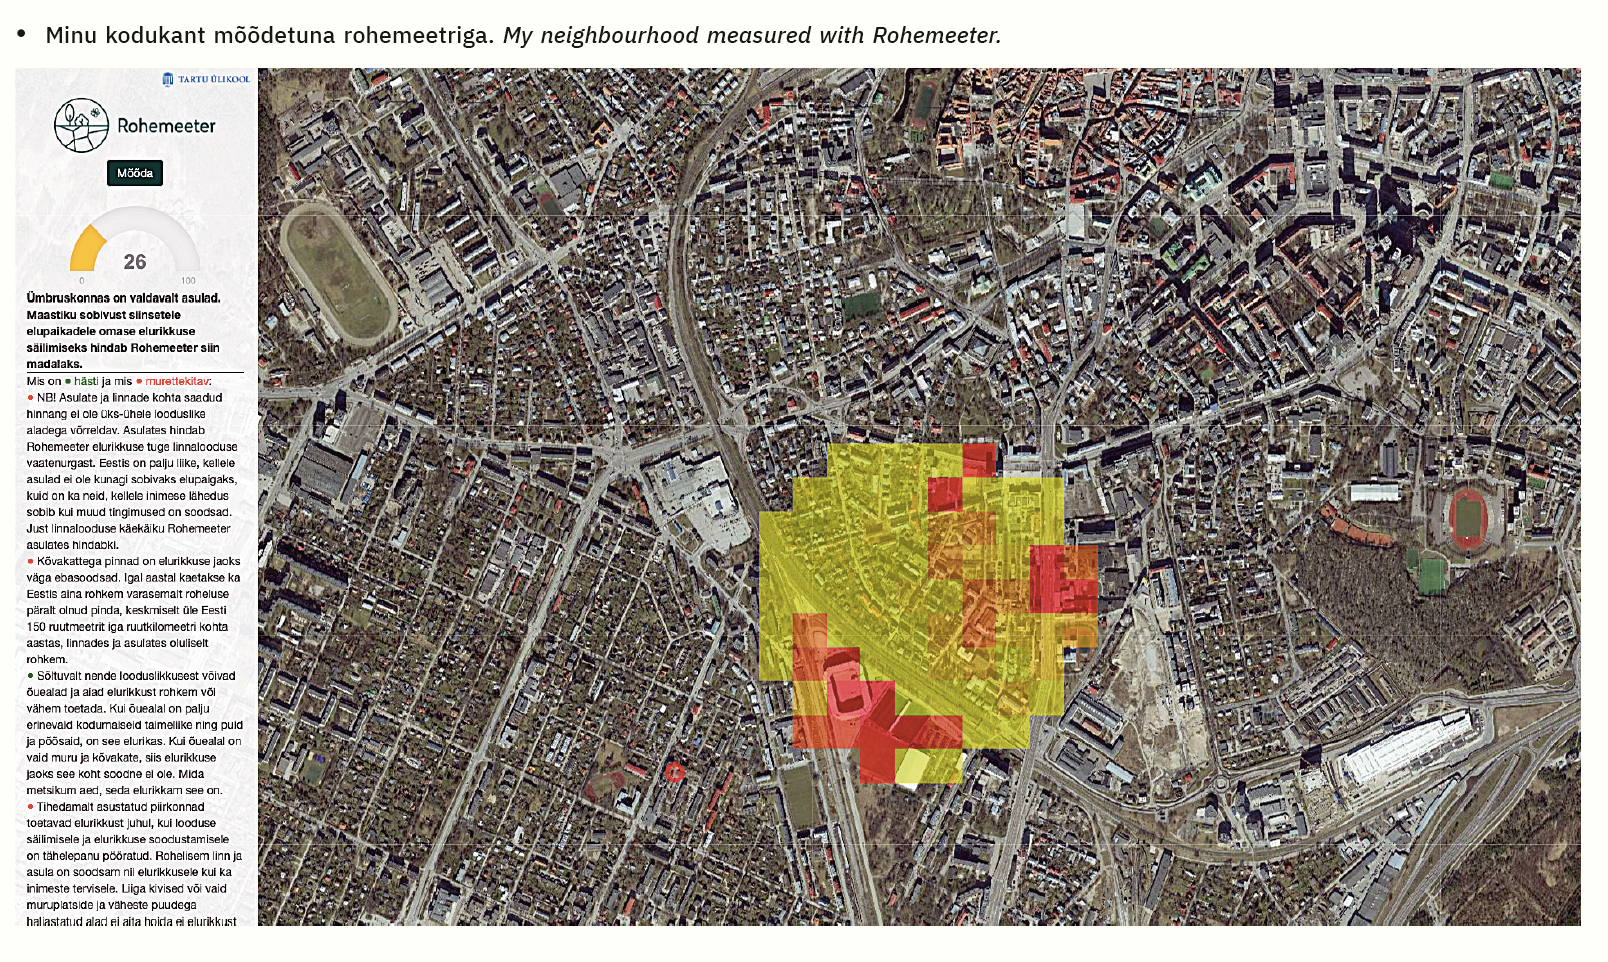
Green Meter is a tool to aid us in decision-making toward an environment in our own backyard or public space in general that is suitable for humans and other species alike. Green Meter provides additional suggestions on how to sustain or improve biodiversity in a particular region. Green Meter input data is composed of current and historical data on Estonian habitats and distribution of species, several layers of map descriptive of environmental conditions and indices on landscape structure. Utilised data is mainly open data sourced from Estonia’s national data systems or international databases. The value of each 100×100-metre observation square is identified by 15–40 data layers, in total the app uses over 70 data layers.
Green Twin
The only logical step from two-dimensional landscape analysis is toward three-dimensional landscape modelling and simulations which allow for a completely new level of analysing and testing landscape alterations, especially when coupled with augmented or virtual reality tools. The digital twins of towns and cities should include green infrastructure elements in addition to the built environment to ensure flexible urban development. The Green Twin project is creating a 3D library of plants found in the Tallinn and Helsinki area, supported by a digital twin interface. The solution enables adding plants and other landscape data layers to the digital twins of cities.
The inclusive platform used alongside the Green Twin enables three-dimensional visualisation and analysis of different spatial projects, their online introduction and provision of feedback.
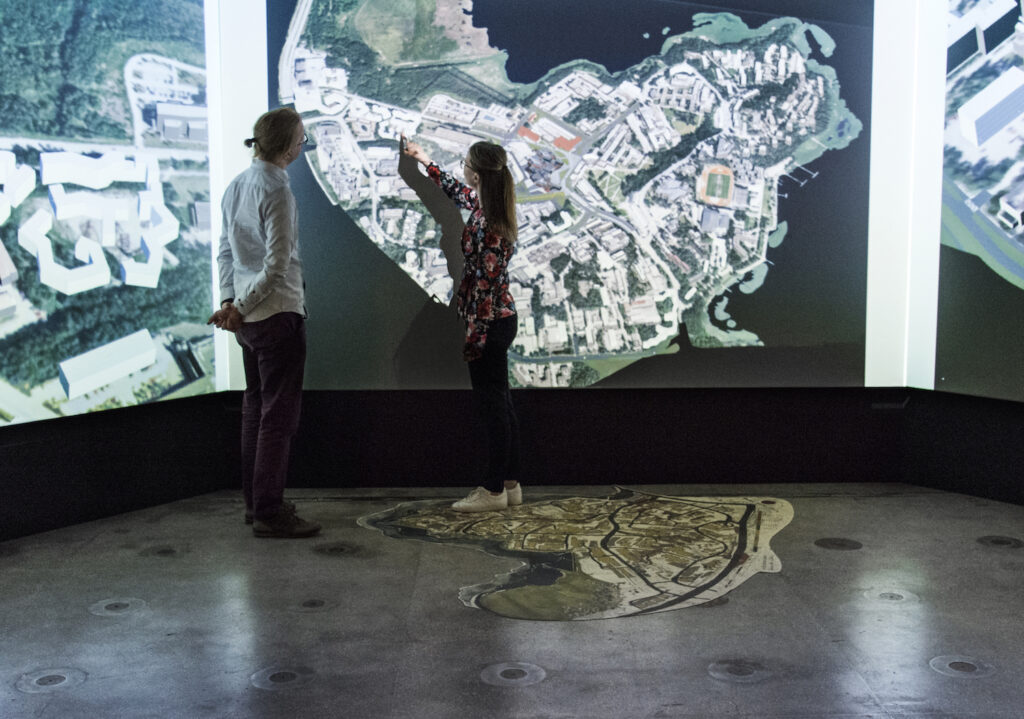
Game architecture enables enhancing the landscape model with additional functions which, using virtual reality tools, make it easier to understand how time-bound changes (such as time of day, weather conditions and time of year) might affect the planned landscape solution. A testing environment called the CAVE (cave automatic virtual environment), i.e., the virtual centre of smart urban planning7, will enable to merge discussions with virtual experience during co-design processes. The Green Twin project is one of four pilot projects to be initiated by the Tallinn University of Technology FinEst Smart City Centre of Excellence this year.
This work has been supported by the European Commission through the H2020 project Finest Twins (grant No. 856602).

KRISTI GRIŠAKOV is an urban planner and researcher from Tallinn University of Technology at the FinEst Smart City Centre of Excellence. Her research interests are focused on the utilisation of spatial data and future-conceptualising tools such as scenario thinking in strategic urban planning.
HEADER: Living+ lab or the virtual urban design testing laboratory of Aalto University. Photo: Annamari Tolonen
PUBLISHED: Maja 103 (winter 2021) Smart Living Environment
1 Ian McHarg I.; Design with nature; (New York, Natural History Press; 1969)
2 Per Stahlschmidt, Simon Swaffield, Jorgen Primdahl, Vibeke Nellemann.; Landscape Analysis: Investigating the potentials of space and place, (London: Routledge; 2017).
3 Priit Ingver, ‘Interpretation and implementation of open data in landscape analysis and concept solutions’. (MA thesis, Tallinn University of Technology, 2019).
4 https://www.fin.ee/riigihaldus-ja-avalik-teenistus-kinnisvara/riigi-kinnisvara/tuhjenevate-korterelamute-projekt
5 See also: European Landscape Convention https://kliimaministeerium.ee/elurikkus-keskkonnakaitse/euroopa-noukogu-maastikukonventsioon
6 https://rohemeeter.ee/
7 https://www.aalto.fi/en/aalto-built-environment-laboratory